Adding a statistical layer
The user selects the {Add statistical layer} button ![]() . A window is displayed containing a list of statistical data banks and, within the bank, a hierarchical tree of thematically structured data to create a statistical layer.
. A window is displayed containing a list of statistical data banks and, within the bank, a hierarchical tree of thematically structured data to create a statistical layer.
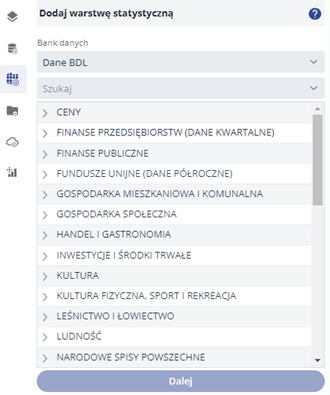
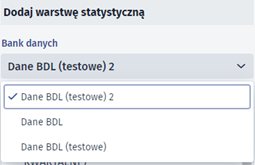
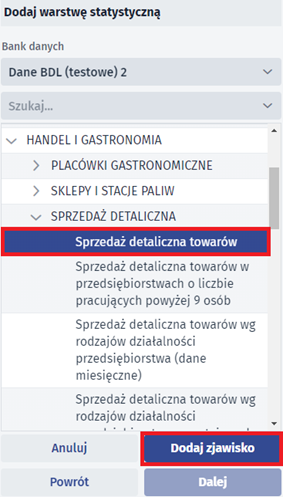
The user selects the data bank from which the data will be added in the module.
The user selects the topic of interest from the tree. An alternative option is to search for the topic by entering a string in the [Search...] field.
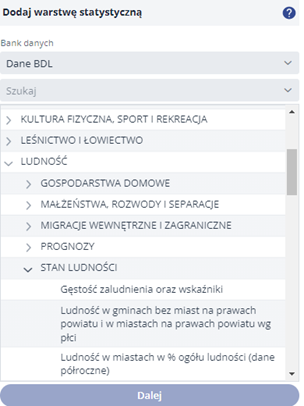
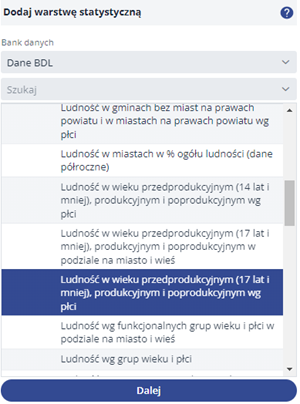
The user selects the {Next} button, which is only activated when the level containing the thematic data is selected in the tree. A form opens which allows the user to select the phenomena available in the cartographic presentation.
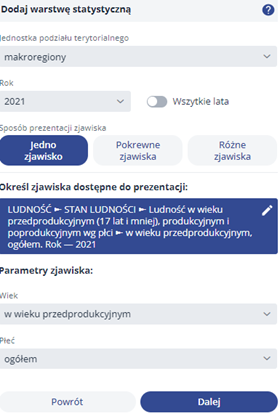
The user defines how the layer will be displayed by specifying the available parameters. The user then selects the {Next} button. Depending on what the user has selected as {Mode of presentation of the phenomenon} in the next step, the corresponding visualisation tools will be available. {One phenomenon}:
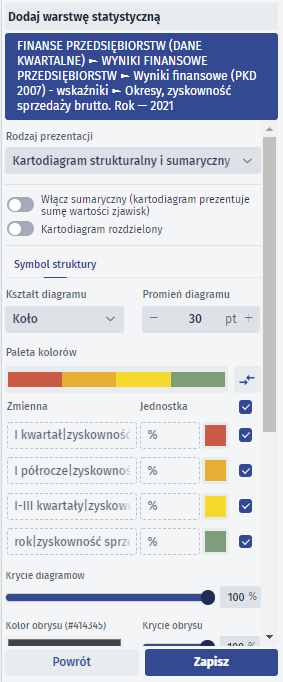
{Related phenomena}:
{Miscellaneous phenomena} (another phenomenon needs to be added):
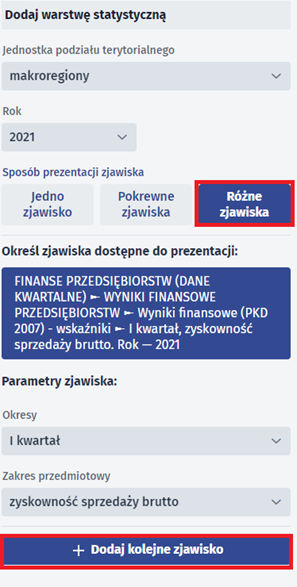
The user selects the {Add another phenomenon} button - a format is displayed in which the user selects another phenomenon from the available list.
The user indicates the phenomenon in the list and selects the {Add phenomenon} button.
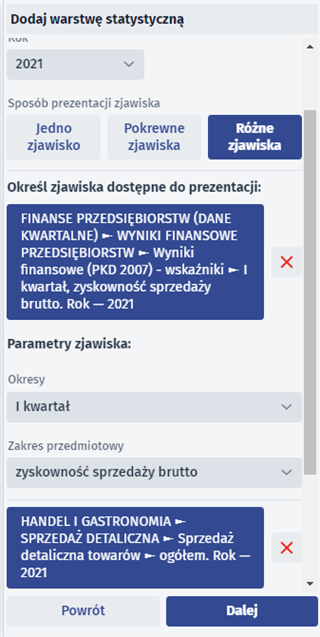
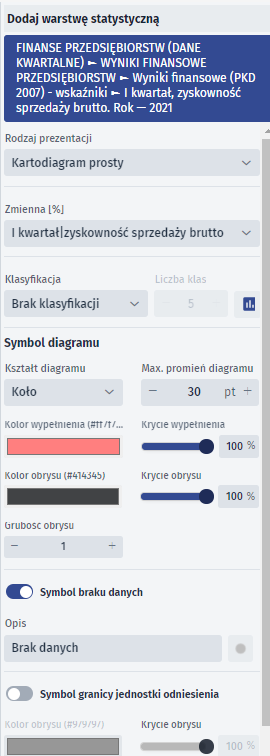
The user then selects the {Next} button and proceeds to symbolise the phenomena using the tools available in the format.
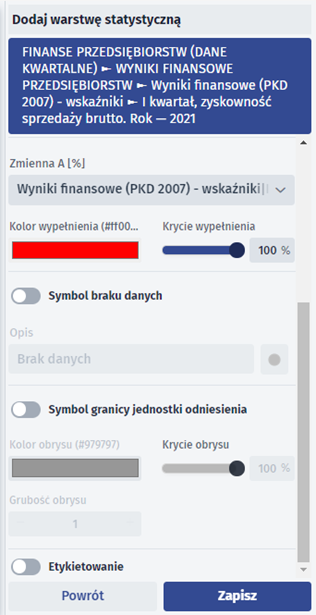
The user selects the {Save} button after specifying the symbolisation for the phenomenon.
The {Back} button takes you back to the previous step of creating the layer.