Module functions
This section describes the individual functions of the map portal:
- Logo
- Zoom-in and zoom-out tool
- Thematic layers manager
- Search
- Legend
- Identification and edition
- Adding an object
- Table
- Statistics
Logo
After clicking the logo, the user is redirected to website which URL was defined by the composition creator.

Zoom-in and zoom-out tool
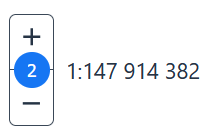
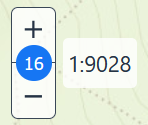
This tool allows with {plus} to zoom in the map view by a defined scale level, and accordingly {minus} will allow to zoom out the map view. After moving the cursor over the button, the application will display the current map scale.
Thematic layers manager
In order to launch the layers window, the user chooses the {Layers} icon ![]() . After activating this function, the user can choose which base and thematic layers will be displayed. To switch the visibility of the base layer, the icon {Visibility}
. After activating this function, the user can choose which base and thematic layers will be displayed. To switch the visibility of the base layer, the icon {Visibility} ![]() - after its activation, the selected layer will become the active layer, which simultaneously deactivates the existing layer (the icon changes to
- after its activation, the selected layer will become the active layer, which simultaneously deactivates the existing layer (the icon changes to ![]() ). Thematic layers, unlike base layers, can be displayed independently of each other. By clicking LPM and dragging the selected layer in the layers window, the user can change the order in which it is displayed. By clicking on {Menu} for a layer
). Thematic layers, unlike base layers, can be displayed independently of each other. By clicking LPM and dragging the selected layer in the layers window, the user can change the order in which it is displayed. By clicking on {Menu} for a layer ![]() the user can use additional options:
the user can use additional options:
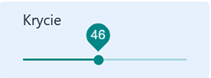
{Cover} set the visibility scale of the layer using the slider:
Using the {Etiquity} slider, enable and disable the visibility of the labels for the layer

Use the {Increase to extent} option to bring the visibility of the map closer to the extent of the layer

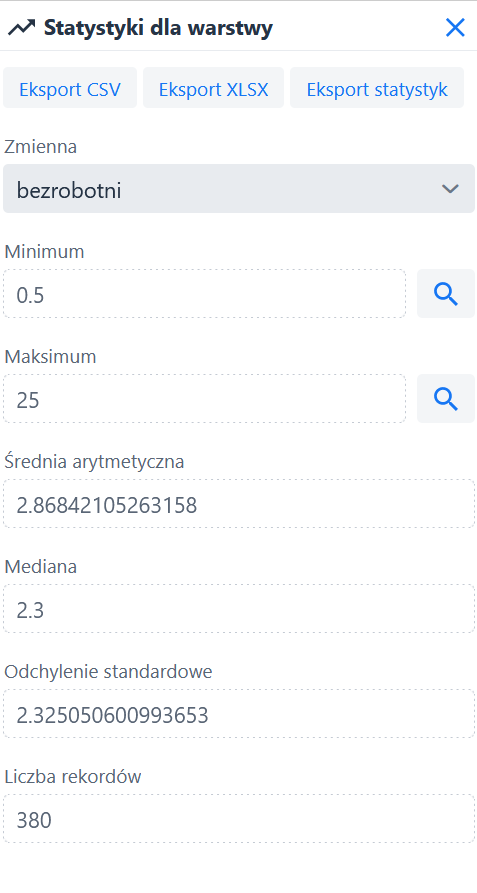
Display the layer's statistics using the {Show Statistics} button.

The user can display statistics for a specific {Variable} by selecting from the list. Display the {Minimum} and {Maximum} values on the map using (![]() ). Read statistical values for the layer and export tabular data using (
). Read statistical values for the layer and export tabular data using (  ) or (
  ) or statistics (
  ) as text document.
Search
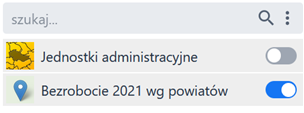
The tool allows searching for objects depending on the loaded layer. The user can select the layer on which to search for objects. For this purpose, the user clicks the button (![]() ) assigned to the search field and then, using the switcher, selects the appropriate layer(s).
) assigned to the search field and then, using the switcher, selects the appropriate layer(s).
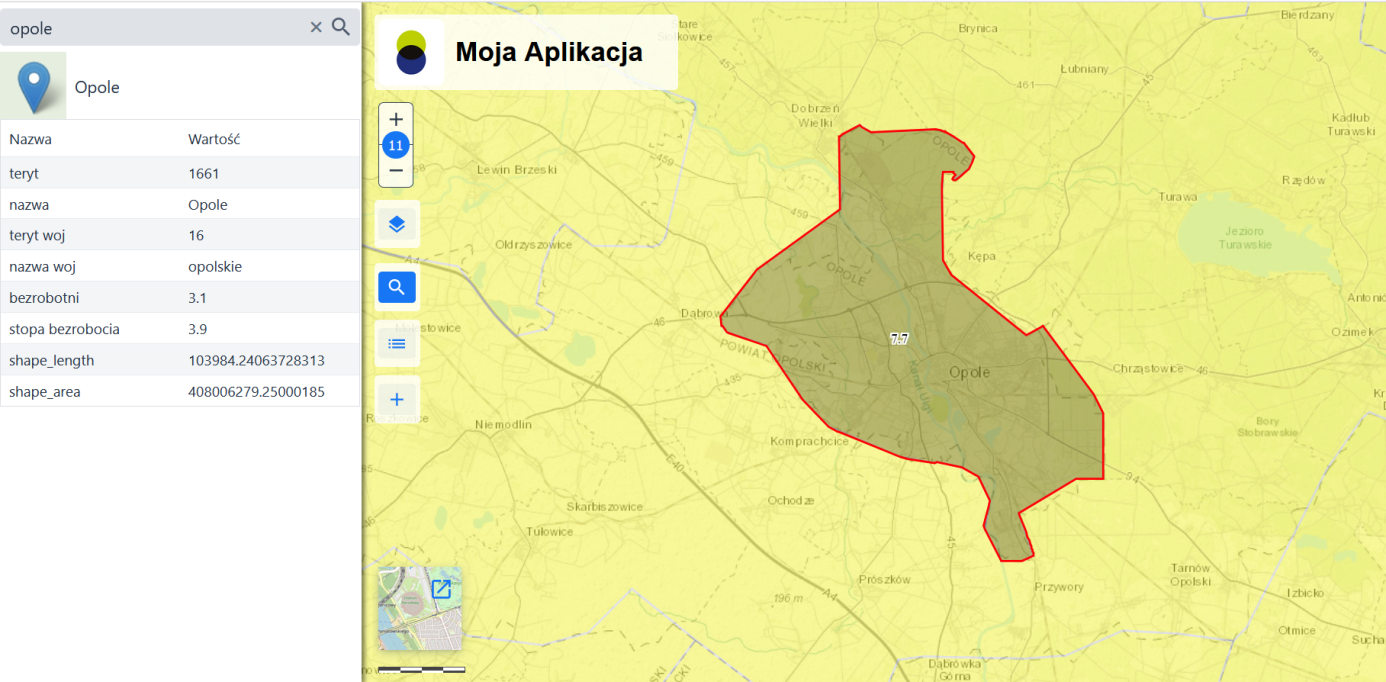
After entering the initial phrase in the [Search] field, the application will suggest sample searches:
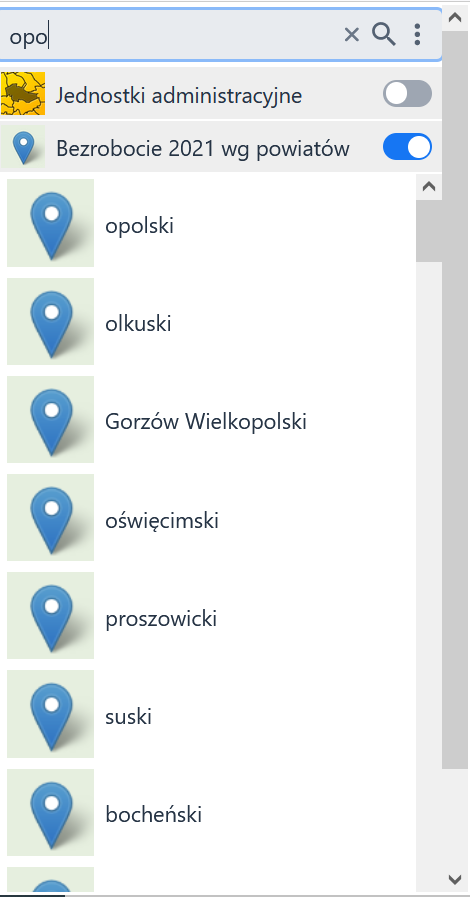
The user selects the object they are looking for from the list, or manually enters its name. The module will then display the list of objects matching the user's query.
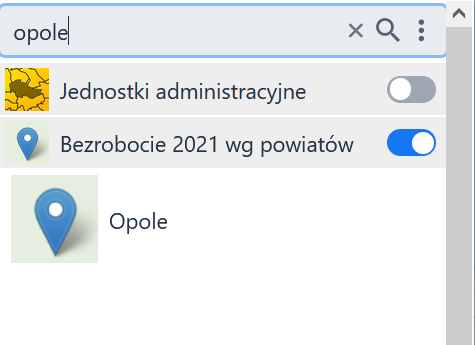
Once the cursor is over a selected object, its full name is displayed, and the cursor ![]() marks its location in the map window. Clicking the selected object with the LPM key enlarges the map and opens the object identification window.
marks its location in the map window. Clicking the selected object with the LPM key enlarges the map and opens the object identification window.
Legend
After activating the {Legenda} icon ( ![]() ), the legend for the currently activated thematic layers will be displayed.
), the legend for the currently activated thematic layers will be displayed. 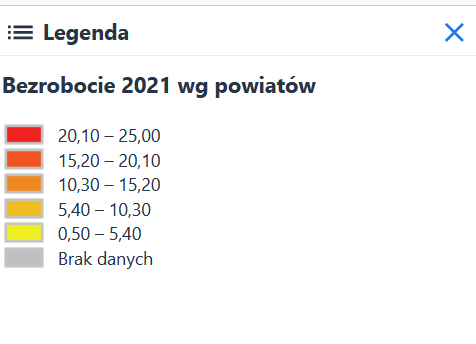
Identification and edition
In order to identify an object on the map, the user clicks with the LPM on the selected object. The module will display information about the object.
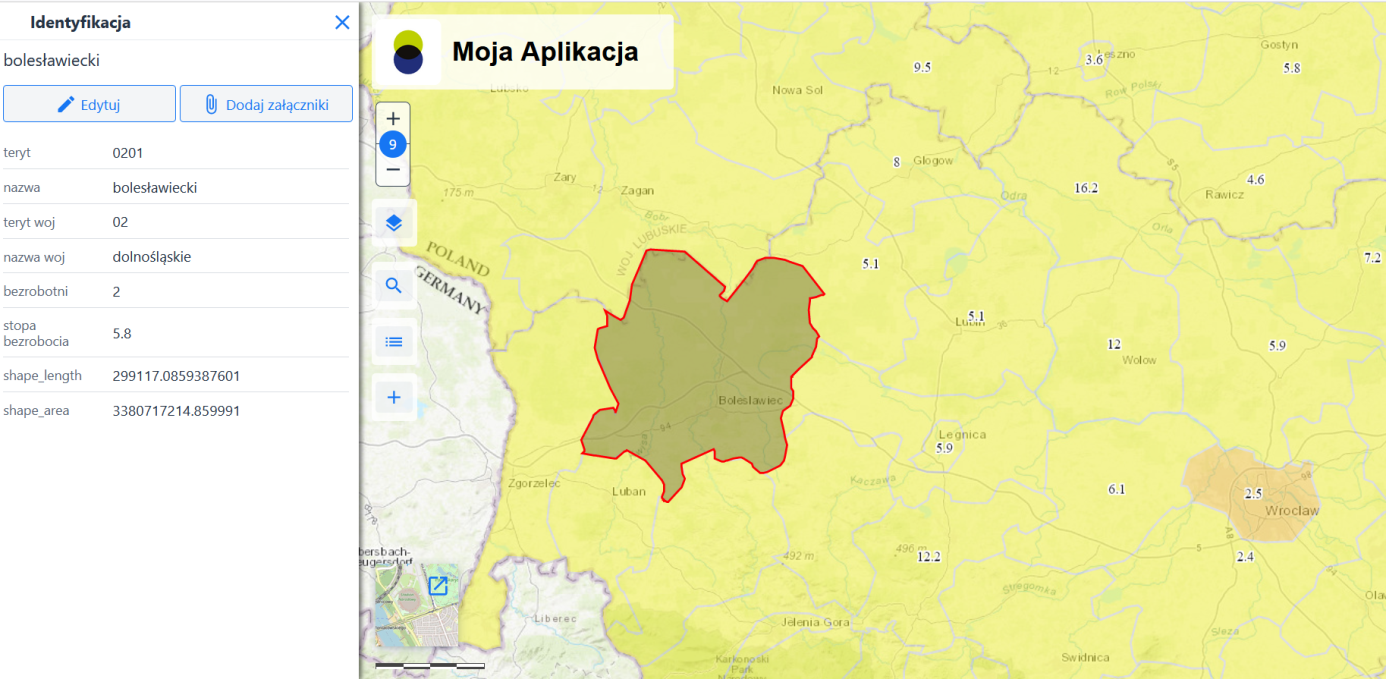
From the identification form, editing tools are available  . After selecting the {Edit} option, the module displays editing tools and makes an editing form available in order to make any possible descriptive changes to a selected object.
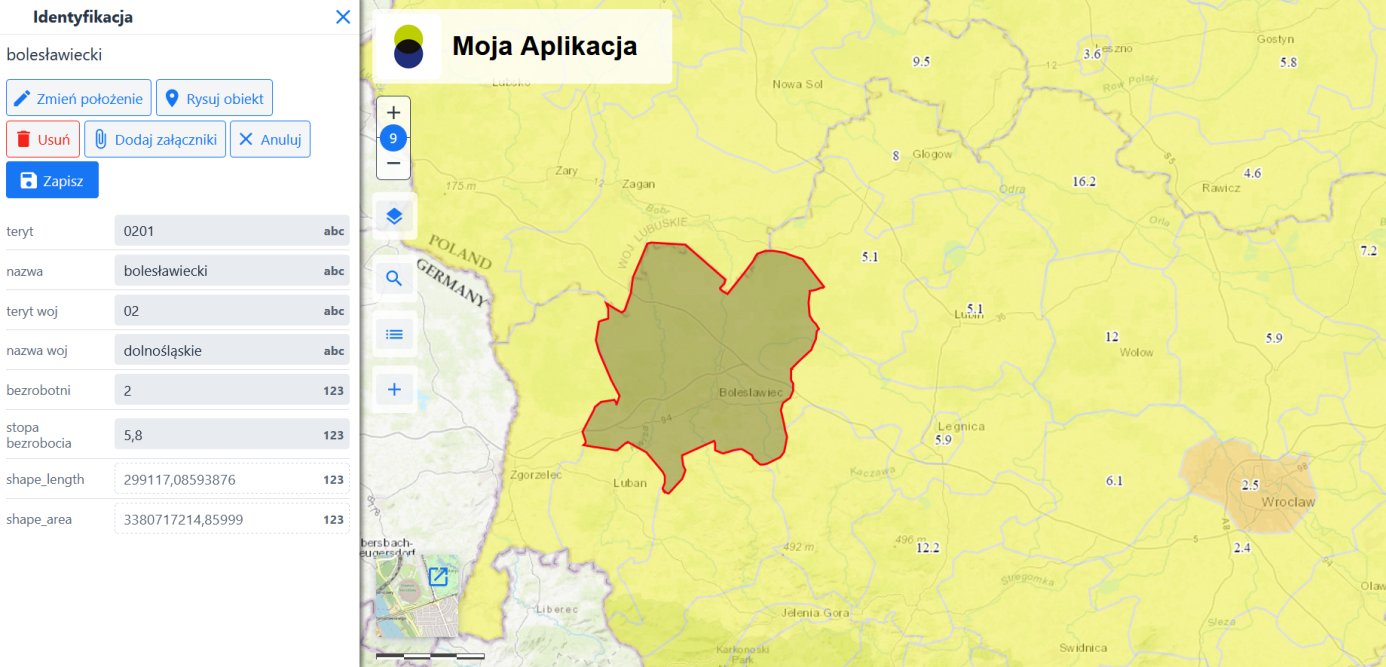
The user has a possibility to make descriptive changes for an object, as well as the following actions:
- Change position - allows to change the geometry of an object

- Draw object

- Delete - Removes an object from a layer

- Add attachments

- Cancel - cancels all changes

- Save - Saves your editing changes

Adding an object
The {Add Object} tool (![]() ) allows you to add an object to a layer.
) allows you to add an object to a layer.
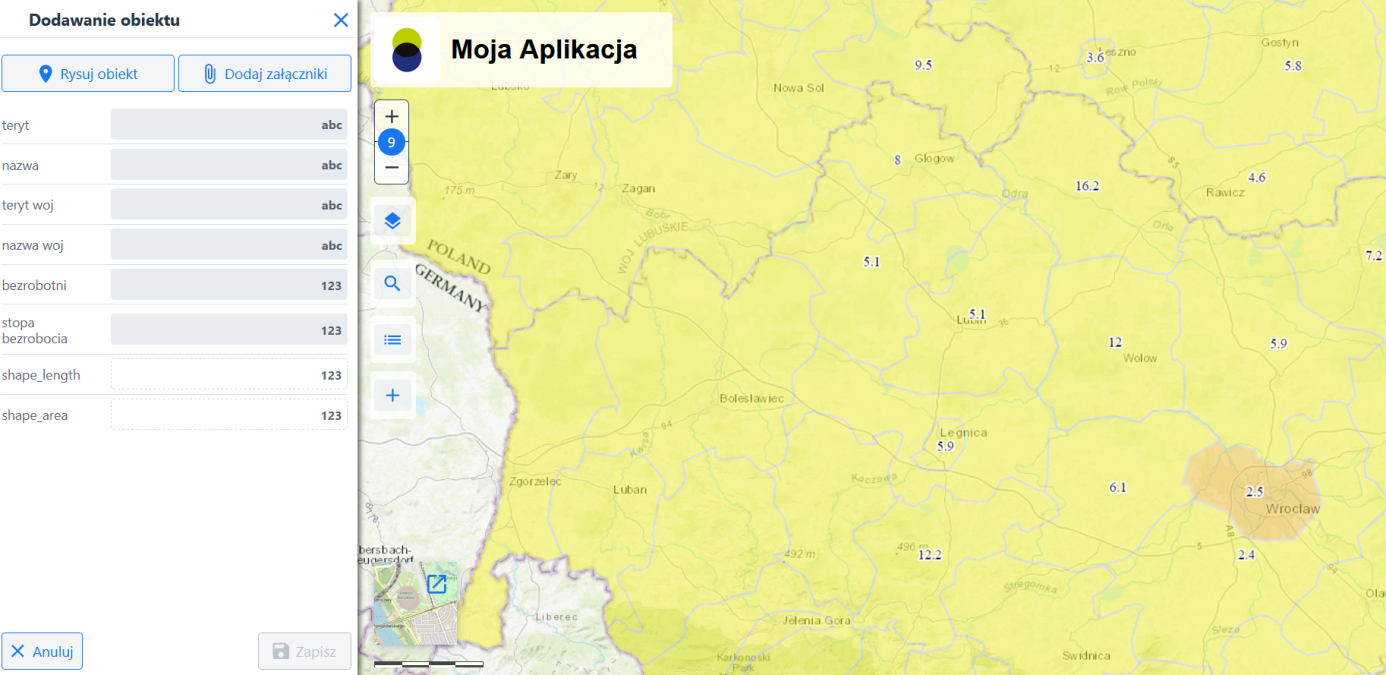
The user has at his disposal both a sketchpad tool to apply geometry ( ), as well as an editing form for entering an object description and adding an attachment
 . Once the editing steps have been taken, the user can finally cancel the changes with the {Cancel} button or save the new object with the {Save} button.
Table
When the {Table} icon (![]() ) is selected, a preview of the attribute table for the active layer is displayed.
) is selected, a preview of the attribute table for the active layer is displayed.
The module displays the table preview below the map window.
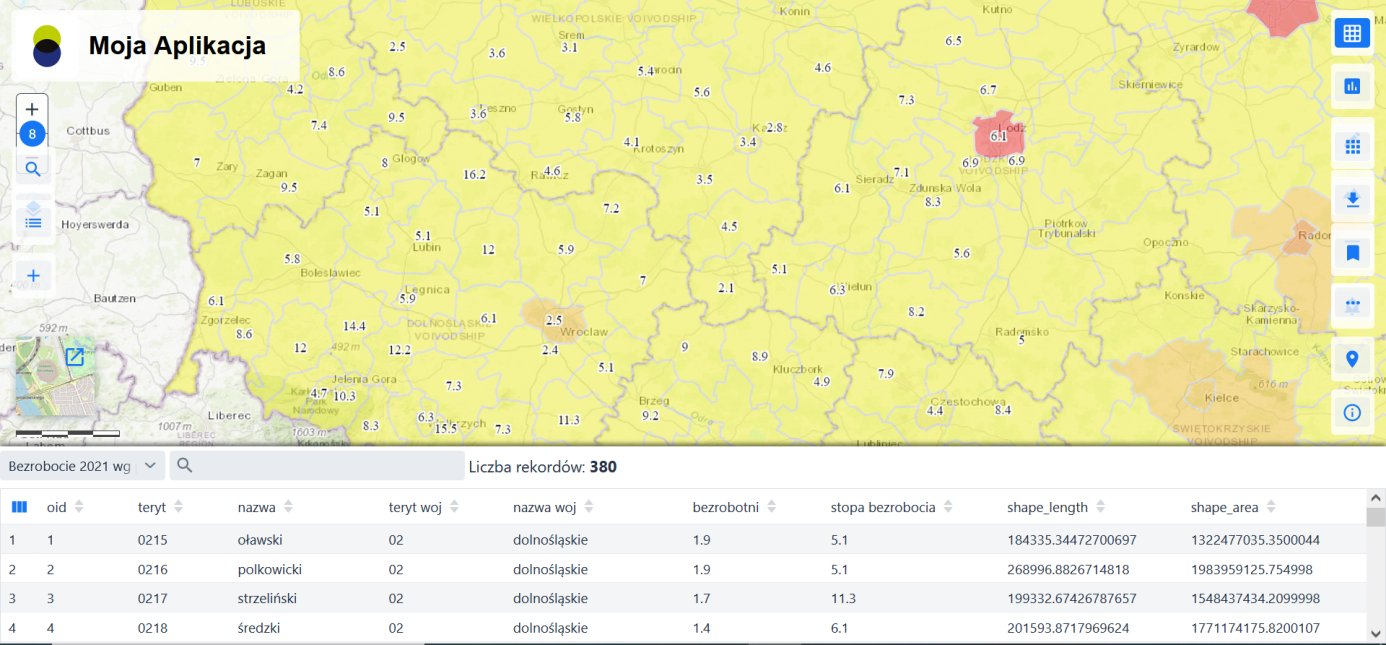
In the table, the user can select the active layer  . To change the active layer, the user selects {
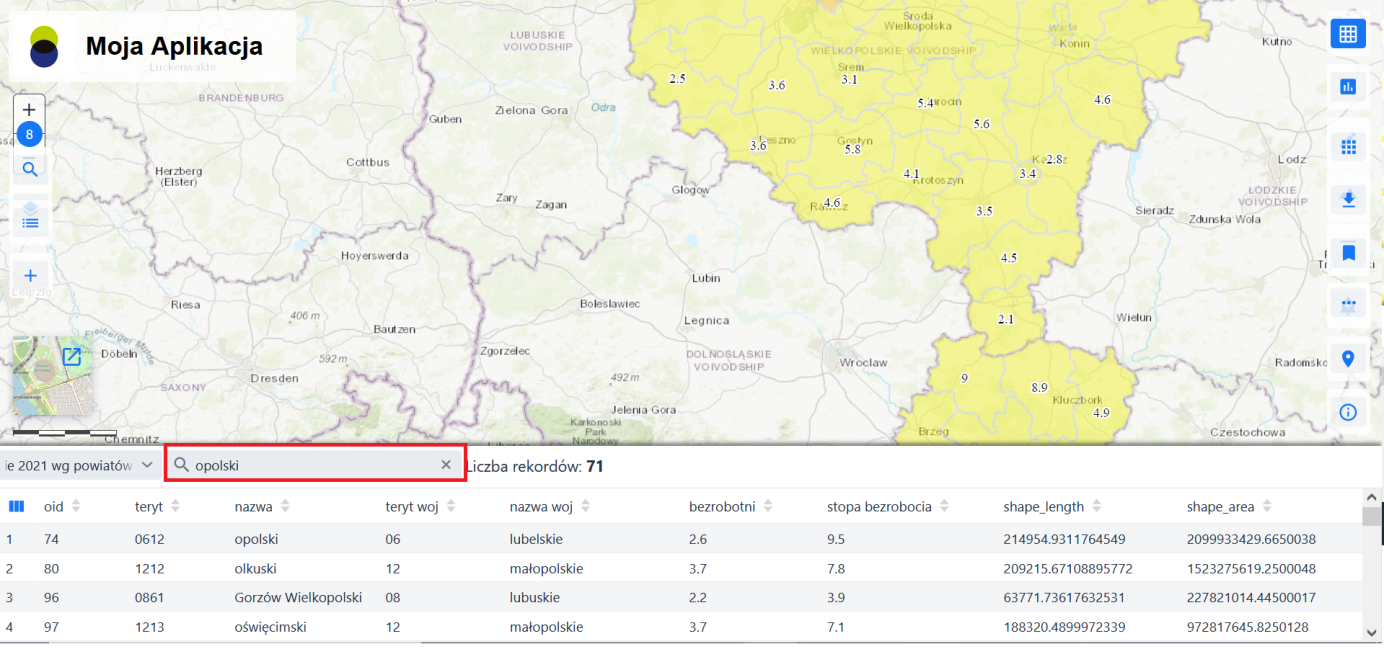
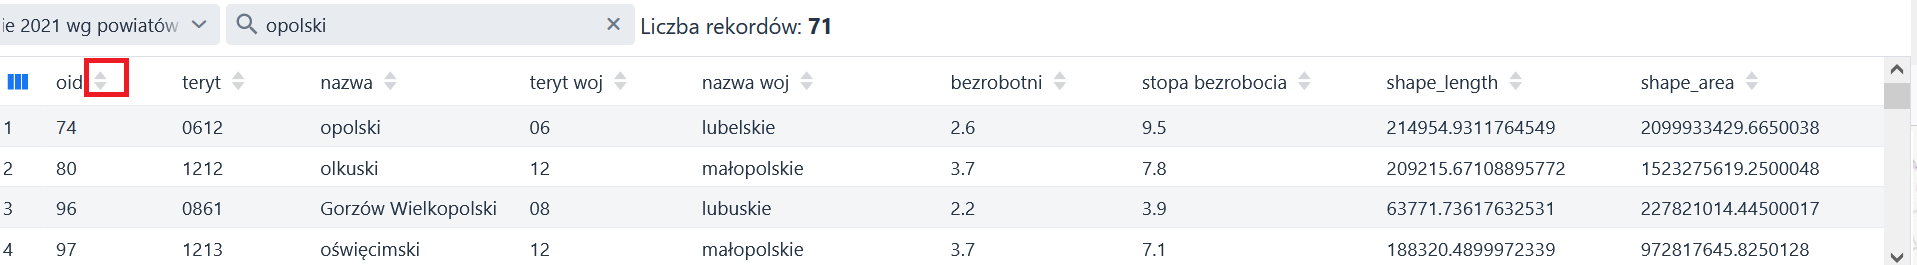
![]() }. The module displays a list of available layers. A search is available in the table, which allows the user to narrow down the results displayed in the table or to search for a specific record. The module displays the number of found records containing the searched phrase.
}. The module displays a list of available layers. A search is available in the table, which allows the user to narrow down the results displayed in the table or to search for a specific record. The module displays the number of found records containing the searched phrase.
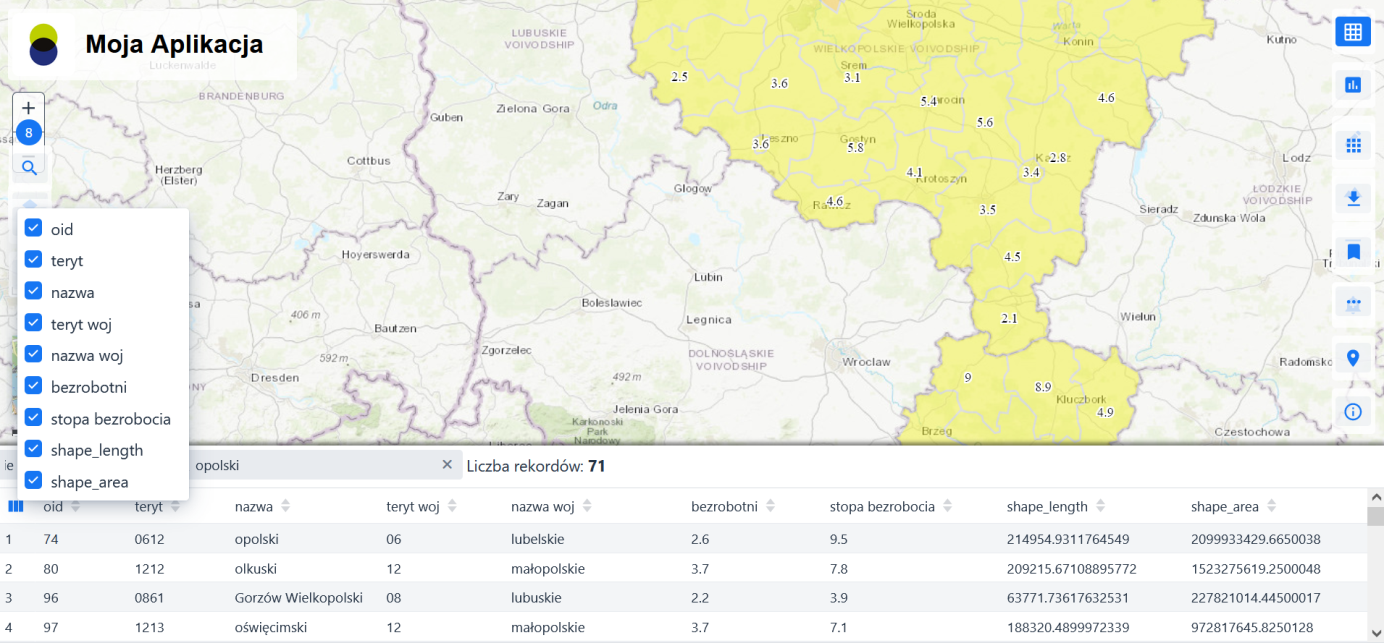
From the table, a function is available to hide/unhide columns in the table. To hide/unhide selected columns, the User selects the {Columns} button (![]() ). A window opens with a list of available columns. The user selects the columns to hide/unhide and unchecks/check boxes next to the selected items. The table automatically adjusts to the changes made.
). A window opens with a list of available columns. The user selects the columns to hide/unhide and unchecks/check boxes next to the selected items. The table automatically adjusts to the changes made.
In addition, the user can sort the data in the table. In order to sort the data in selected columns, the user clicks on the {Sort} (![]() ) located in the column header. The sorting functionality works on all available columns of the table. The sorting direction is shown in the headers of the columns that are subject to sorting.
) located in the column header. The sorting functionality works on all available columns of the table. The sorting direction is shown in the headers of the columns that are subject to sorting.
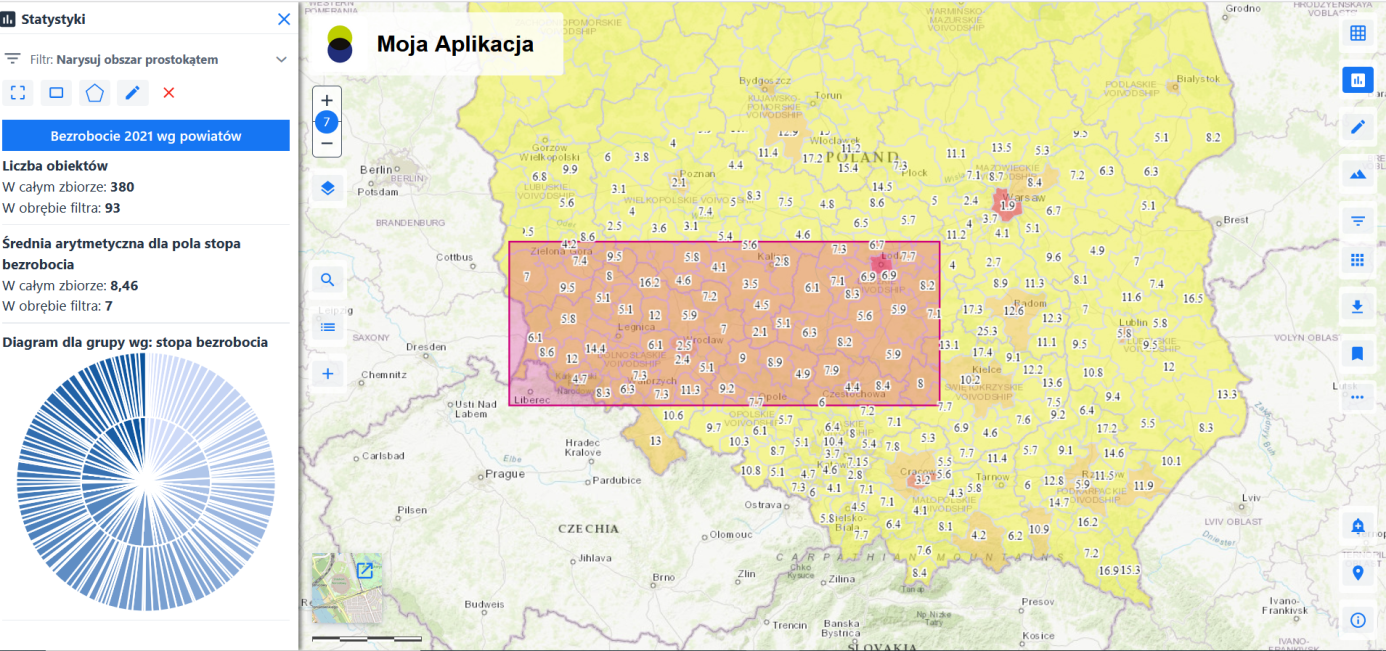
Statistics
The {Statistics} tool(![]() ) tool allows you to display statistics for the active thematic layer.
) tool allows you to display statistics for the active thematic layer.
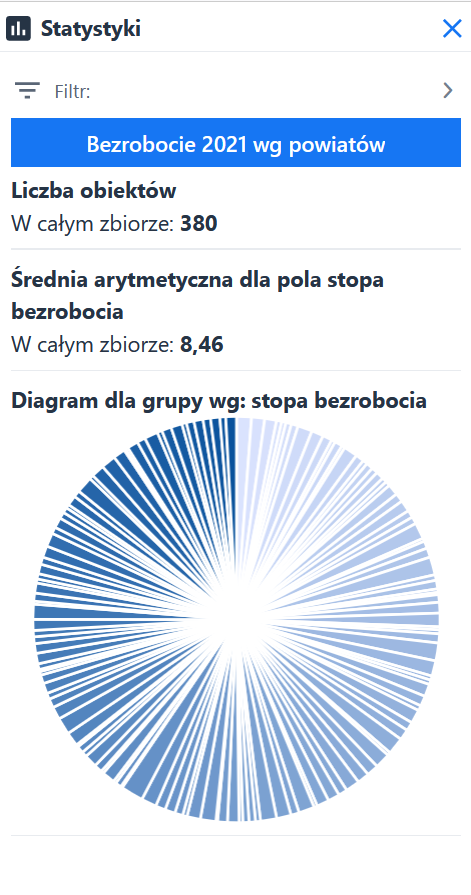
The user has the possibility to apply filters and obtain statistics results according to the query (filter):
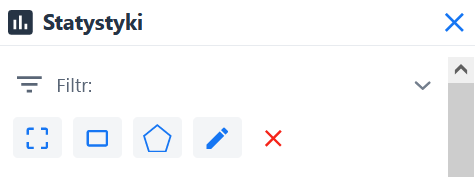
- Filter {Map window} (
 )– change the displayed statistics with reference to data in the map window only
 - Filter {Draw area with rectangle} (
 ) – change the displayed statistics with respect to the area indicated by the rectangle
 - Filter {Draw area with polygon} (
 )– change the displayed statistics in relation to the area indicated by the polygon
 - Filter {Import geometry from sketch} (
 )()– change the displayed statistics in relation to the geometry imported from the sketchbook
 - The {Clear} button (
 ) – clear the filters used for the statistics